- Home
- About ANT
-
Products
asa
asa is a highly flexible EEG/ERP and MEG analysis package with a variety of source reconstruction, signal analysis and MRI processing features.
.jpg)
eego mylab
The new frontier in multimodal brain research. With up to 16 kHz sampling rate, 256 EEG channels and unique software features, eego mylab gives you an unprecedented in-depth understanding of the human brain.
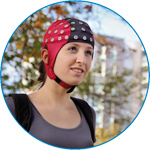
eego sports
eego sports offers complete freedom to collect high-density EEG data, bipolar EMG signals, and a variety of physiological sensor data, wherever and whenever required, with publish quality data in less than 15 minutes!
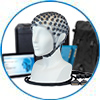
waveguard net
The waveguard net sets a new standard for research applications requiring high-density EEG data acquisition with quick preparation time, high flexibility, and subject comfort.
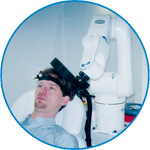
visor2
Our new and upgraded visor2 solutions integrate all the latest technologies for navigated rTMS, dual-coil navigation support, EEG-TMS recordings and pre-surgical evaluation for the highest quality in research and clinical procedures.
powerMAG ANT
The PowerMAG ANT 100 rTMS stimulator is designed for the specific needs of high-end TMS applications. Powerful high-frequency TMS as well as high precise single pulse and repetitive pulse protocols are combined in one single device.
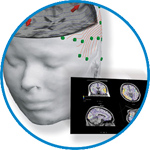
xensor
xensor offers the solution for digitization of 3D electrode positions. xensor takes care of the whole procedure; it records, visualizes and stores positions acquired with a dedicated digitizer.
waveguard original
waveguard original is the cap solution for EEG measurements compatible with fMRI, MEG and TMS system. Use of active shielding guarantees performance in even the most demanding environments.

waveguard connect
waveguard connect EEG caps are a perfect match for hospitals and institutes aiming at reliable EEG, maximum uptime and great patient comfort! For optimal signal quality, the electrodes are made of pure, solid tin.
waveguard touch
waveguard touch is a dry electrode EEG cap. The unique Ag/AgCl coated soft polymer electrodes provide stable, research-grade EEG signals while maintaining subject comfort. The combination of these innovative dry electrodes and the industry-leading waveguard cap makes waveguard touch the best solution for dry EEG.
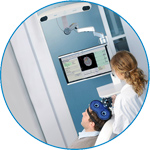
smartmove
smartmove allows planning of a complete TMS session ahead by defining stimulation sites based on anatomical MRI information and functional information like fMRI, PET or EEG/MEG.
- References
- Support
- Events
- News
- Contact Us
 Read more
.jpg)

You are here
Computer-aided autism diagnosis via second-order difference plot area applied to EEG empirical mode decomposition
Computer-aided autism diagnosis via second-order difference plot area applied to EEG empirical mode decomposition
Autism spectrum disorder (ASD) is a name for a group of neurodevelopmental conditions that are characterized by some degree of impairment in social interaction, verbal and non-verbal communication, and difficulty in symbolic capacity and repetitive behaviors. The only protocol followed currently for ASD diagnosis is the qualitative behavioral assessment by experts through internationally established descriptive scaling standards. The assessment can, therefore, be affected by the degree of the evaluator experience as well as by the level of the descriptive standard robustness. This paper presents an EEG-based quantitative approach intended for automatic discrimination between children with typical neurodevelopment and children with ASD. The suggested work relies on second-order difference plot (SODP) area as a discriminative feature: First, every EEG channel in a 64 electrode cap—for every volunteer—is decomposed into intrinsic mode functions (IMFs) by empirical mode decomposition (EMD). Next, the second-order difference plot for the first ten intrinsic mode functions—of every channel—is sketched. Third, the value of the elliptical area —for every plot—is calculated. The 95% confidence ellipse area is used as the discriminative feature. Fourth, paired t-student test is applied to the vectors consisting of discriminative feature values for counterpart channels/IMFs (e.g., channel FPz/IMF7 in autistic and neurotypical) for all volunteers. Finally, principal component analysis (PCA) and neural network (NN) are applied to the SODP area feature matrix for two-class classification (ASD and neurotypical). Moreover, the 3D mapping of EEG SODP area values was implemented and analyzed. The obtained results show that the conducted t-student tests yield values of less than 0.05, and that the NN two-class classification based on SODP features leads to a 94.4% accuracy, which indicates significant differences between SODP area values of children with neurotypical development and those diagnosed with ASD. The obtained results have also been emphasized by the analysis of the findings of the performed 3D mapping.


ANT Neuro
Welbergweg 74
7556 PE Hengelo
Netherlands
T: +31 (0) 85 049 8175
F: +31 (0) 85 049 3919
E: Send us an email